MedCVE
An analysis of 1,515 healthcare-tagged CVE records, from cleaning and metric definitions to nine JSON exports and a static dashboard.
- Context
- Personal analysis project on a public vulnerability dataset. It continues the earlier MedRadar work.
- Stack
- Python 3.12, pandas and Jupyter for analysis, pytest and ruff for checks, and a static HTML and JavaScript dashboard that reads the exported JSON.
- Role
- Sole author
- Repository
- github.com/HeyItWorked/MedCVE (Public)
At a glance
Question
Which healthcare-related vulnerabilities are most severe and most reachable, and how should a small team decide what to look at first?
The data is a public CSV of CVE records from the NIST National Vulnerability Database, tagged with healthcare keywords. It is public vulnerability data, not patient records.
Cleaning
- All 1,515 records are kept. Counts and shares use the full set, including rows with missing values.
- Dates are parsed, the CVSS score is converted to a number, and a publication year is derived for the annual view.
- An empty field and the string
N/Aare read as the same missing value. - Severity, CVSS score and attack vector are each missing in 18 records.
Definitions
- Rates use the full dataset as the denominator, so missing values stay visible instead of quietly inflating a rate.
- CVSS scores of exactly 0.0 and missing scores fall in no band, so band shares can add up to less than 100%.
- The domain priority score and the triage score are ordering heuristics with hand-picked weights, not security scores.
- The metric builders live in
analysis/metrics.pyas plain functions; the notebook imports them, adds plots and the write-up, and exports the JSON.
What the data shows
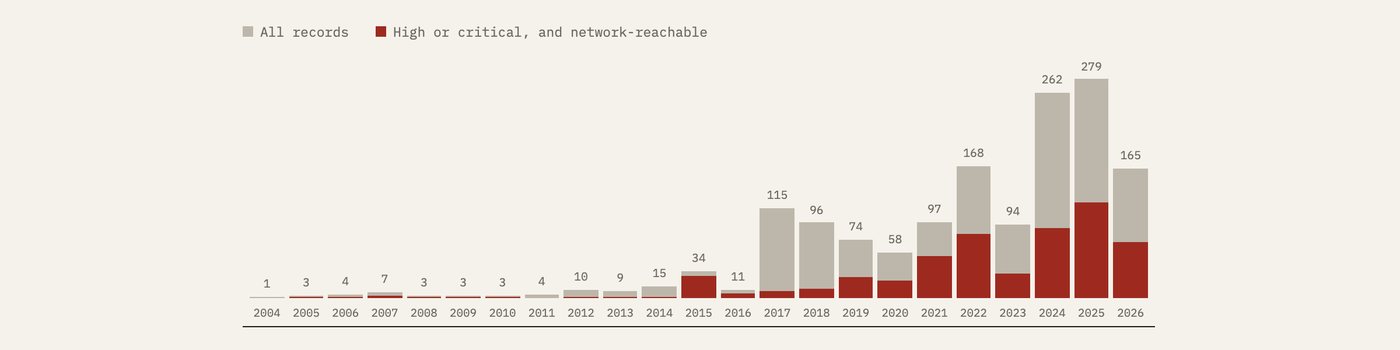
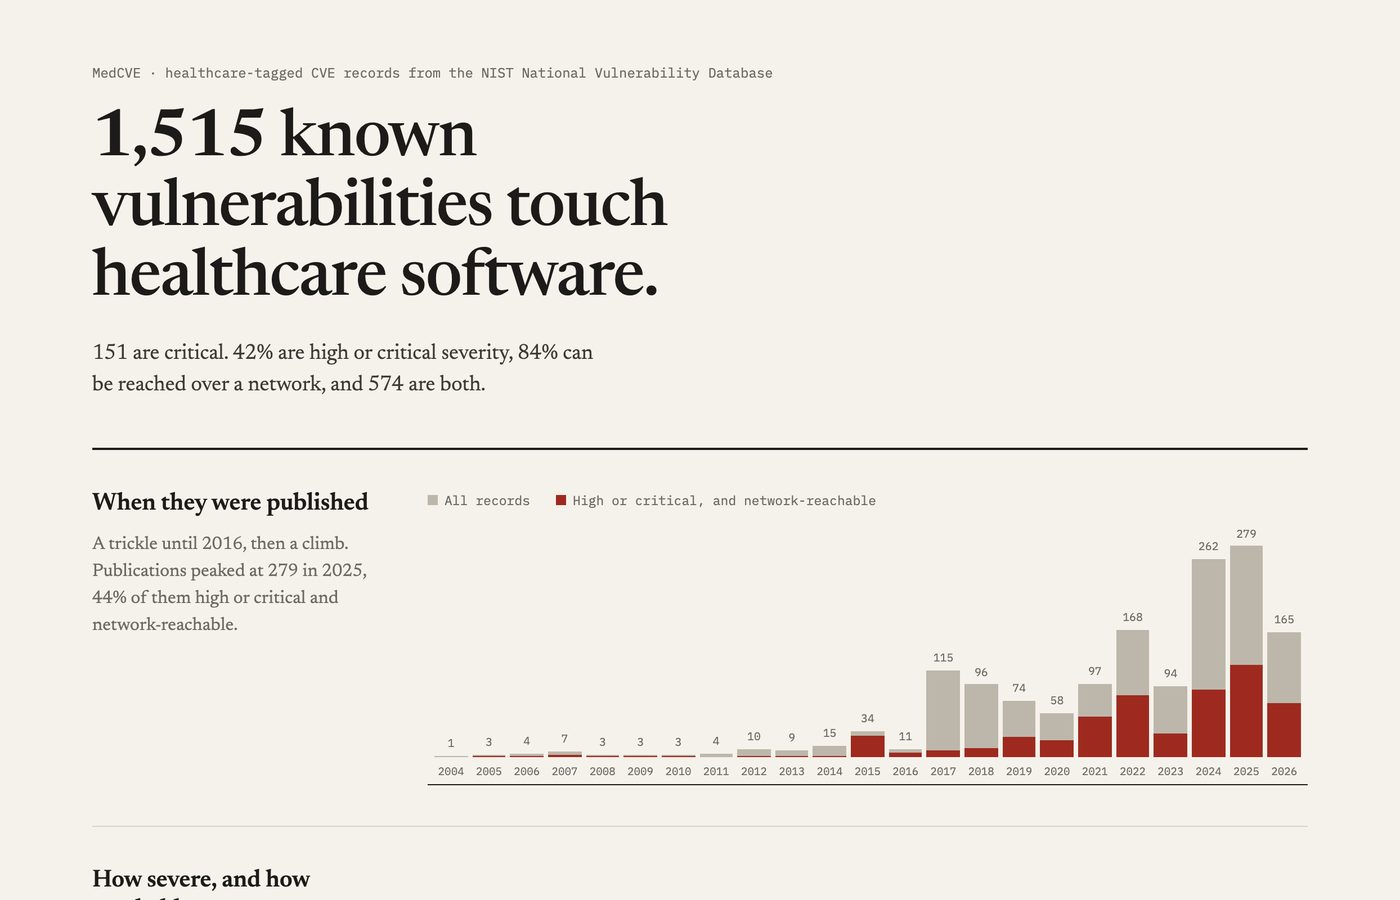
The largest severity group is medium (720 records). The most common weaknesses are SQL injection, CWE-89 (308), and cross-site scripting, CWE-79 (247).
Dashboard
Verification
Checked on 24 Sep 2026 with Python 3.12: all 19 tests pass. They check the metric builders on a small synthetic CSV, and check that the committed exports still match what the raw data produces. CI runs ruff and pytest on every push.